Erdős-Rényi Graph 
Erdős-Rényi Graph
This example demonstrates how to generate Erdős-Rényi Graphs using Erdos_Renyi(). There are two variants of graphs:
Erdos_Renyi(n, p)will generate a graph where each edge between any two pair of nodes has an independent probabilitypof existing.Erdos_Renyi(n, m)will pick a graph uniformly at random out of all graphs withnnodes andmedges.
We generate two graphs of each, so we can confirm that our graph generator is truly random.
import igraph as ig
import matplotlib.pyplot as plt
import random

# Set a random seed for reproducibility
random.seed(0)

# Generate two Erdos Renyi graphs based on probability
g1 = ig.Graph.Erdos_Renyi(n=15, p=0.2, directed=False, loops=False)
g2 = ig.Graph.Erdos_Renyi(n=15, p=0.2, directed=False, loops=False)

# Generate two Erdos Renyi graphs based on number of edges
g3 = ig.Graph.Erdos_Renyi(n=20, m=35, directed=False, loops=False)
g4 = ig.Graph.Erdos_Renyi(n=20, m=35, directed=False, loops=False)

# Print out summaries of each graph
ig.summary(g1)
ig.summary(g2)
ig.summary(g3)
ig.summary(g4)

fig, axs = plt.subplots(2, 2)
# Probability
ig.plot(
    g1,
    target=axs[0, 0],
    layout="circle",
    vertex_color="lightblue"
)
ig.plot(
    g2,
    target=axs[0, 1],
    layout="circle",
    vertex_color="lightblue"
)
axs[0, 0].set_ylabel('Probability')
# N edges
ig.plot(
    g3,
    target=axs[1, 0],
    layout="circle",
    vertex_color="lightblue",
    vertex_size=0.15
)
ig.plot(
    g4,
    target=axs[1, 1],
    layout="circle",
    vertex_color="lightblue",
    vertex_size=0.15
)
axs[1, 0].set_ylabel('N. edges')
plt.show()
The received output is:
IGRAPH U--- 15 18 --
IGRAPH U--- 15 21 --
IGRAPH U--- 20 35 --
IGRAPH U--- 20 35 --
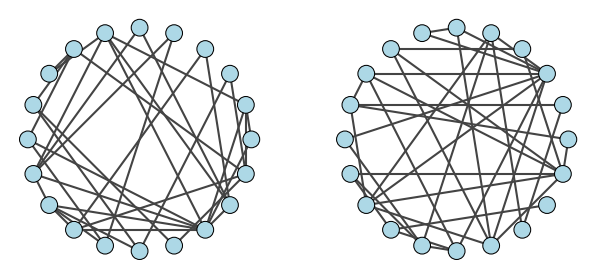
Erdős-Rényi random graphs With probability p = 0.2 (top) and with number of edges m = 35 (bottom).
Note
Even when using the same random seed, results can still differ depending on the machine the code is being run from.