Cliques 
Cliques
This example shows how to compute and visualize cliques of a graph using cliques().
import igraph as ig
import matplotlib.pyplot as plt

g = ig.Graph.Famous('Zachary')

# Compute cliques
cliques = g.cliques(4, 4)

# Plot each clique highlighted in a separate axes
fig, axs = plt.subplots(3, 4)
axs = axs.ravel()
for clique, ax in zip(cliques, axs):
    ig.plot(
        ig.VertexCover(g, [clique]),
        mark_groups=True, palette=ig.RainbowPalette(),
        edge_width=0.5,
        target=ax,
    )

plt.axis('off')
plt.show()
The plot looks like this:
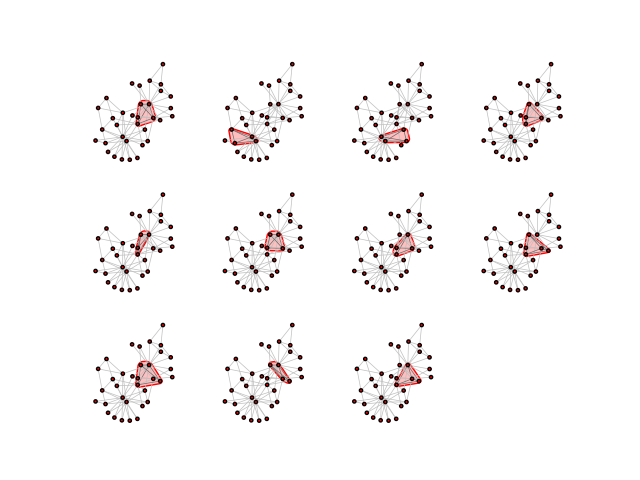
Each clique of the graph is highlighted in one of the panels
Advanced: improving plotting style
If you want a little more style, you can color the vertices/edges within each clique to make them stand out:
import igraph as ig
import matplotlib.pyplot as plt

g = ig.Graph.Famous('Zachary')
cliques = g.cliques(4, 4)

fig, axs = plt.subplots(3, 4)
axs = axs.ravel()
for clique, ax in zip(cliques, axs):
    # Color vertices yellow/red based on whether they are in this clique
    g.vs['color'] = 'yellow'
    g.vs[clique]['color'] = 'red'

    # Color edges black/red based on whether they are in this clique
    clique_edges = g.es.select(_within=clique)
    g.es['color'] = 'black'
    clique_edges['color'] = 'red'
    # also increase thickness of clique edges
    g.es['width'] = 0.3
    clique_edges['width'] = 1

    ig.plot(
        ig.VertexCover(g, [clique]),
        mark_groups=True,
        palette=ig.RainbowPalette(),
        target=ax,
    )

plt.axis('off')
plt.show()
Lo and behold:
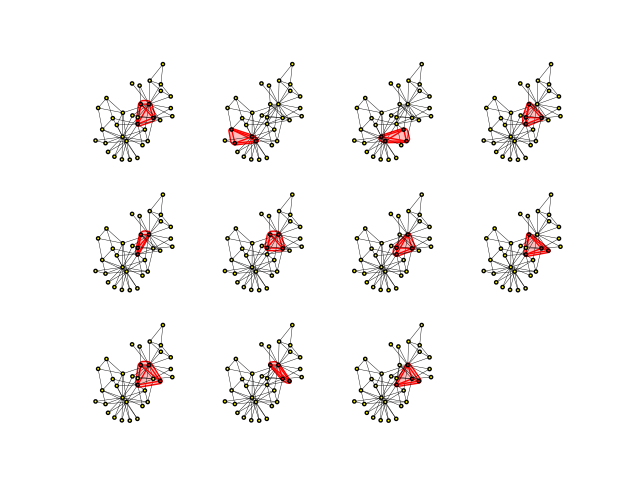
Each clique of the graph is highlighted in one of the panels, with vertices and edges highlighted as well.